6

I have created a Google map using JavaScript API V3. I am drawing a number of zip code polygons. The polygons are of different colors depending upon some condition. Now I want to draw straight lines/ hash marks inside some of the polygons depending upon certain criteria. How can we do it. Below is the code which I have written for drawing the polygons.

var path = [
{% for polycoord in zip.zip_info.zip_polygon %}
    new google.maps.LatLng({{polycoord.1}}, {{polycoord.0}}),
{% endfor %}
];

var polygon_{{ forloop.counter }} = new google.maps.Polygon(
{
    path:path, 
    clickable:true,
    strokeColor: '#000000',
    strokeOpacity: 0.15,
    strokeWeight: 2,
    fillColor: fillColor,
    fillOpacity: 1,
    zipcode: '{{zip.zip_info.zipcode}}'
});

polygon_{{ forloop.counter }}.setMap(map);

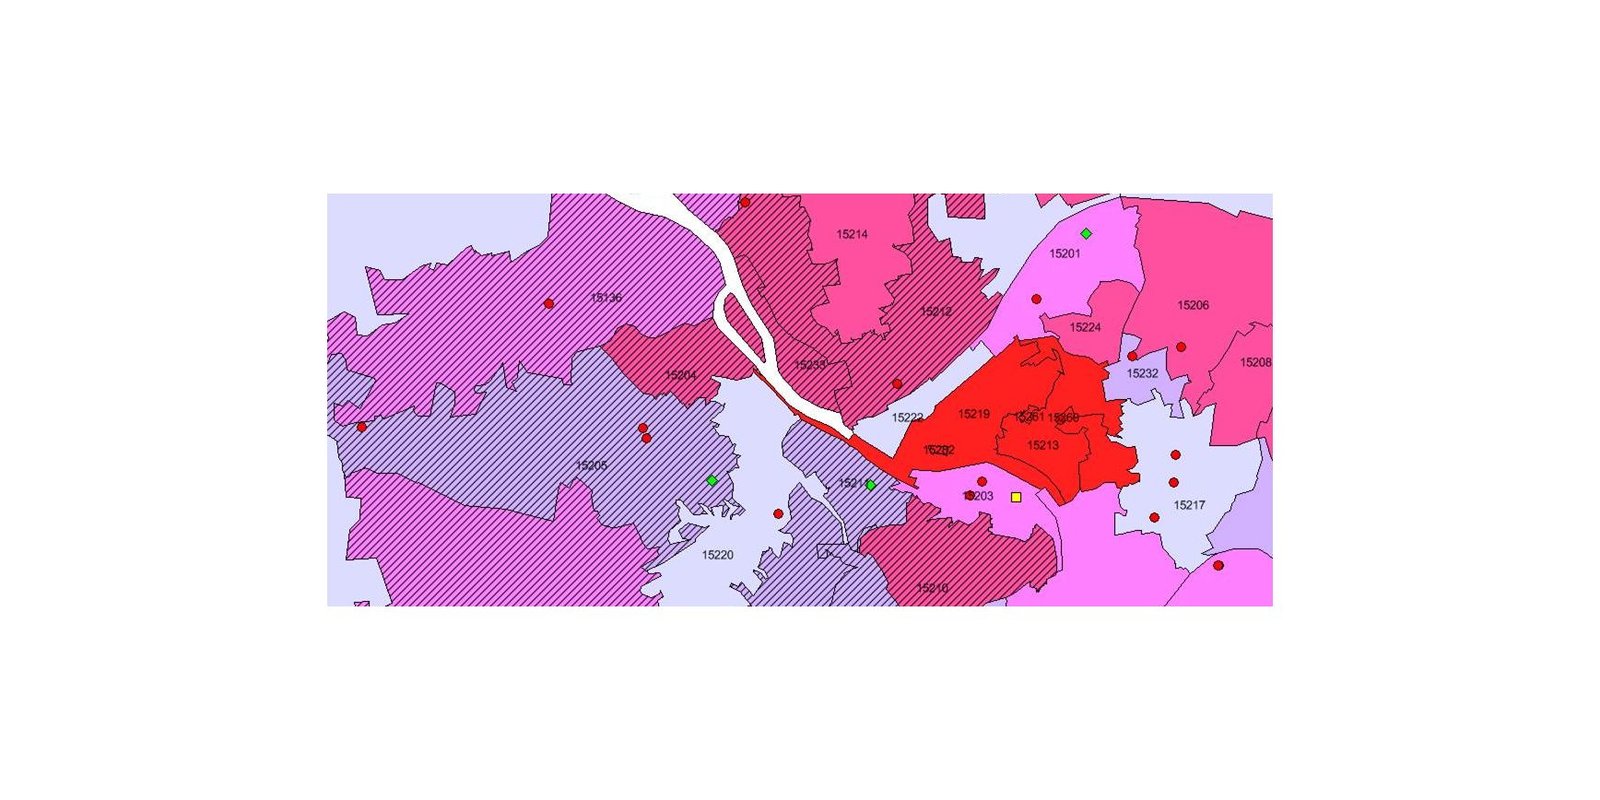
Here is an image showing my requirement:

enter image description here

You can see in the image some of the polygons are shaded with straight lines, and some are shaded with only colors.

5
  • Sounds like you want a fill "texture", like this enhancement request
    – geocodezip
    Apr 4, 2013 at 20:10
  • Yeah want to add a texture, otherwords we can say i want to draw lines inside polygon. can we do it.
    – sandeep
    Apr 5, 2013 at 3:41
  • You can't do it with the API at this time. You can vote for that enhancement request (or find another better one for your purpose, or create a new one). You may be able to do something with Polylines, but it will probably impact the performance.
    – geocodezip
    Apr 5, 2013 at 4:44
  • Thanks geocodezip. But where can I post the request for enhancement of API or where can I vote. Please guide.
    – sandeep
    Apr 5, 2013 at 5:33
  • The link in my first comment. (code.google.com/p/gmaps-api-issues/issues/detail?id=598)
    – geocodezip
    Apr 5, 2013 at 5:36

2 Answers 2

7

I have been working on the same issue. This is what I have so far: jsFiddle of Example

The BW.PolyLineFill function creates a Custom Overlay. It takes 4 parameters with the last two being optional.

 1. path: an array of Google LatLng objects   
 2. map: the map to attach theoverlay to 
 3. fillColor: (optional) the color of the fill, default is red. 
 4. strokeColor: (optional) the stroke color, default is black

I haven't tested the performance and it probably still needs more tweaking, but it should get you started.

Relevant code:

PolyLineFill.prototype = new google.maps.OverlayView();
function PolyLineFill(poly, map, fill, stroke) {
    var bounds = new google.maps.LatLngBounds();
    for (var i = 0; i < poly.length; i++) {
        bounds.extend(poly[i]);
    }

    //initialize all properties.
    this.bounds_ = bounds;
    this.map_ = map;
    this.div_ = null;
    this.poly_ = poly;
    this.polysvg_ = null;
    this.fill_ = fill;
    this.stroke_ = stroke;

    // Explicitly call setMap on this overlay
    this.setMap(map);
}

PolyLineFill.prototype.onAdd = function () {
    // Create the DIV and set some basic attributes.
    var div = document.createElement('div');
    div.style.borderStyle = 'none';
    div.style.borderWidth = '0px';
    div.style.position = 'absolute';

    //createthe svg element
    var svgns = "http://www.w3.org/2000/svg";
    var svg = document.createElementNS(svgns, "svg");
    svg.setAttributeNS(null, "preserveAspectRatio", "xMidYMid meet");

    var def = document.createElementNS(svgns, "defs");

    //create the pattern fill 
    var pattern = document.createElementNS(svgns, "pattern");
    pattern.setAttributeNS(null, "id", "lineFill");
    pattern.setAttributeNS(null, "patternUnits", "userSpaceOnUse");
    pattern.setAttributeNS(null, "patternTransform", "rotate(-45)");
    pattern.setAttributeNS(null, "height", "7");
    pattern.setAttributeNS(null, "width", "7");
    def.appendChild(pattern);

    var rect = document.createElementNS(svgns, "rect");
    rect.setAttributeNS(null, "id", "rectFill");
    rect.setAttributeNS(null, "fill", this.fill_ || "red");
    rect.setAttributeNS(null, "fill-opacity", "0.3");
    rect.setAttributeNS(null, "stroke", this.stroke_ || "#000");
    rect.setAttributeNS(null, "stroke-dasharray", "7,7");
    rect.setAttributeNS(null, "height", "7");
    rect.setAttributeNS(null, "width", "7");
    pattern.appendChild(rect);

    svg.appendChild(def);

    //add polygon to the div
    var p = document.createElementNS(svgns, "polygon");
    p.setAttributeNS(null, "fill", "url(#lineFill)");
    p.setAttributeNS(null, "stroke", "#000");
    p.setAttributeNS(null, "stroke-width", "1");
    //set a reference to this element;
    this.polysvg_ = p;
    svg.appendChild(p);

    div.appendChild(svg);

    // Set the overlay's div_ property to this DIV
    this.div_ = div;

    // We add an overlay to a map via one of the map's panes.
    // We'll add this overlay to the overlayLayer pane.
    var panes = this.getPanes();
    panes.overlayLayer.appendChild(div);
}

PolyLineFill.prototype.AdjustPoints = function () {
    //adjust the polygon points based on the projection.
    var proj = this.getProjection();
    var sw = proj.fromLatLngToDivPixel(this.bounds_.getSouthWest());
    var ne = proj.fromLatLngToDivPixel(this.bounds_.getNorthEast());

    var points = "";
    for (var i = 0; i < this.poly_.length; i++) {
        var point = proj.fromLatLngToDivPixel(this.poly_[i]);
        if (i == 0) {
            points += (point.x - sw.x) + ", " + (point.y - ne.y);
        } else {
            points += " " + (point.x - sw.x) + ", " + (point.y - ne.y);
        }
    }
    return points;
}

PolyLineFill.prototype.draw = function () {
    // Size and position the overlay. We use a southwest and northeast
    // position of the overlay to peg it to the correct position and size.
    // We need to retrieve the projection from this overlay to do this.
    var overlayProjection = this.getProjection();

    // Retrieve the southwest and northeast coordinates of this overlay
    // in latlngs and convert them to pixels coordinates.
    // We'll use these coordinates to resize the DIV.
    var sw = overlayProjection
                .fromLatLngToDivPixel(this.bounds_.getSouthWest());
    var ne = overlayProjection
                .fromLatLngToDivPixel(this.bounds_.getNorthEast());

    // Resize the image's DIV to fit the indicated dimensions.
    var div = this.div_;
    div.style.left = sw.x + 'px';
    div.style.top = ne.y + 'px';
    div.style.width = (ne.x - sw.x) + 'px';
    div.style.height = (sw.y - ne.y) + 'px';

    this.polysvg_.setAttributeNS(null, "points", this.AdjustPoints());
}

PolyLineFill.prototype.onRemove = function () {
    this.div_.parentNode.removeChild(this.div_);
    this.div_ = null;
}
window.BW = {};
window.BW.PolyLineFill = PolyLineFill;
7
  • Any further progress on this? Looks like it works, but as soon as you zoom things don't look correct.
    – BigDubb
    Sep 2, 2014 at 15:55
  • @BigDubb could you be more specific to what is not working? The overlay example in the fiddle example above doesn't align exactly with the boundaries defined on the Google map since I quickly grabbed some Geodata to use for the example. The map projections may be a little different between the one used to gather the data and Google's projections. More accurate data would have better results, or at least data consistent with Google's chosen projection. I believe Google uses a Mercator projection, so if you use another type, you will get a slight shift when translating to screen coordinates. Sep 5, 2014 at 14:55
  • I fire this up in Chrome. Zoom in on Utah and once I get past a specific zoom level it stops dawing the polygon correctly. Parts of it don't render and if you zoom in enough it just disappears all together.
    – BigDubb
    Sep 18, 2014 at 18:01
  • 4
    I have fixed the weird behavior when you zoomed in the map (the svg was being trimmed). I have added a css class to give 100% to its height and width. Now the zoom issue is solved. On the other hand I have changed the type of the shape rendered. I have drawn a path instead a polygon because in my tests, the path element was responding better to mouse events as mouse over, mouse click... Link to my example Dec 11, 2014 at 17:07
  • 1
    If only now someone would point the way how to make it work with multipolygons (polygons with holes in it) :)
    – Tarmo
    Mar 4, 2019 at 8:57
1

I've worked on Bryan Weaver's solution to get it working for editable polygons using the drawing manager. here is my jsfiddle example

function initialize() {
   var map = new google.maps.Map(document.getElementById('map-canvas'), {
     zoom: 5,
     center: {
       lat: 24.886,
       lng: -70.268
     },
     mapTypeId: 'terrain'
   });

   var drawingManager = new google.maps.drawing.DrawingManager({
     drawingControl: true,
     drawingControlOptions: {
       position: google.maps.ControlPosition.TOP_CENTER,
       drawingModes: [google.maps.drawing.OverlayType.POLYGON]
     },

     polygonOptions: {
       fillOpacity: 0,
       strokeWeight: 1,
       strokeColor: '#ff0000',
       clickable: true,
       editable: true,
       draggable: true,
     }
   });

   drawingManager.setMap(map);
   google.maps.event.addListener(drawingManager, 'overlaycomplete', function(event) {
     var poly = event.overlay;
     poly.bk = new BW.PolyLineFill(poly.getPath(), this.map, "red", "#000");

     google.maps.event.addListener(poly, 'dragstart', function(event) {
       if (poly.bk != null) {
         poly.bk.setMap(null);
         poly.bk = null
       }
       poly.isBeingDragged = true;
     });

     google.maps.event.addListener(poly, 'dragend', function(event) {
       if (poly.bk != null) {
         poly.bk.setMap(null);
         poly.bk = null
       }
       poly.bk = new BW.PolyLineFill(poly.getPath(), poly.map, "red", "#000");
       poly.isBeingDragged = false;
     });


     google.maps.event.addListener(poly.getPath(), 'set_at', function(event) {
       if (poly.isBeingDragged) return;
       console.log('set_at');
       if (poly.bk != null) {
         poly.bk.setMap(null);
         poly.bk = null
       }
       poly.bk = new BW.PolyLineFill(poly.getPath(), poly.map, "red", "#000");
     });

     google.maps.event.addListener(poly.getPath(), 'insert_at', function(event) {
       if (poly.bk != null) {
         poly.bk.setMap(null);
         poly.bk = null
       }
       poly.bk = new BW.PolyLineFill(poly.getPath().b, poly.map, "red", "#000");
     });


     drawingManager.setDrawingMode(null);
   });

 }

 ///Start custom poly fill code
 PolyLineFill.prototype = new google.maps.OverlayView();

 function PolyLineFill(poly, map, fill, stroke) {
   var bounds = new google.maps.LatLngBounds();
   for (var i = 0; i < poly.length; i++) {
     bounds.extend(poly.getAt(i));
   }

   //initialize all properties.
   this.bounds_ = bounds;
   this.map_ = map;
   this.div_ = null;
   this.poly_ = poly;
   this.polysvg_ = null;
   this.fill_ = fill;
   this.stroke_ = stroke;

   // Explicitly call setMap on this overlay
   this.setMap(map);
 }

 PolyLineFill.prototype.onAdd = function() {
   // Create the DIV and set some basic attributes.
   var div = document.createElement('div');
   div.style.borderStyle = 'none';
   div.style.borderWidth = '0px';
   div.style.position = 'absolute';

   //https://www.w3schools.com/graphics/svg_reference.asp
   //createthe svg element
   var svgns = "http://www.w3.org/2000/svg";
   var svg = document.createElementNS(svgns, "svg");
   svg.setAttributeNS(null, "height", "100%");
   svg.setAttributeNS(null, "width", "100%");
   svg.setAttributeNS(null, "preserveAspectRatio", "xMidYMid meet");

   //A container for referenced elements
   var def = document.createElementNS(svgns, "defs");

   //create the pattern fill 
   var pattern = document.createElementNS(svgns, "pattern");
   //***************************CHANGE PATTERN HERE**********************************     
   pattern.setAttributeNS(null, "id", "lineFill");
   pattern.setAttributeNS(null, "patternUnits", "userSpaceOnUse");
   //pattern.setAttributeNS(null, "patternTransform", "rotate(-33)");

   pattern.setAttributeNS(null, "height", "60");
   pattern.setAttributeNS(null, "width", "60");
   def.appendChild(pattern);

   var rect = document.createElementNS(svgns, "rect");
   rect.setAttributeNS(null, "id", "rectFill");
   rect.setAttributeNS(null, "fill", "green");
   rect.setAttributeNS(null, "fill-opacity", "0.25");
   rect.setAttributeNS(null, "stroke", "#0000FF");
   rect.setAttributeNS(null, "stroke-width", "8");
   rect.setAttributeNS(null, "stroke-opacity", "0.25");
   rect.setAttributeNS(null, "stroke-dasharray", "10 10");
   rect.setAttributeNS(null, "x", "5");
   rect.setAttributeNS(null, "y", "5");
   rect.setAttributeNS(null, "height", "50");
   rect.setAttributeNS(null, "width", "50");
   rect.setAttributeNS(null, "rx", "25");
   rect.setAttributeNS(null, "ry", "25");
   pattern.appendChild(rect);

   svg.appendChild(def);

   //add polygon to the div
   var p = document.createElementNS(svgns, "polygon");
   p.setAttributeNS(null, "fill", "url(#lineFill)");
   //set a reference to this element;
   this.polysvg_ = p;
   svg.appendChild(p);

   div.appendChild(svg);

   // Set the overlay's div_ property to this DIV
   this.div_ = div;

   // We add an overlay to a map via one of the map's panes.
   // We'll add this overlay to the overlayLayer pane.
   var panes = this.getPanes();
   panes.overlayLayer.appendChild(div);
 }

 PolyLineFill.prototype.AdjustPoints = function() {
   //adjust the polygon points based on the projection.
   var proj = this.getProjection();
   var sw = proj.fromLatLngToDivPixel(this.bounds_.getSouthWest());
   var ne = proj.fromLatLngToDivPixel(this.bounds_.getNorthEast());

   var points = "";
   for (var i = 0; i < this.poly_.length; i++) {
     var point = proj.fromLatLngToDivPixel(this.poly_.getAt(i));
     if (i == 0) {
       points += (point.x - sw.x) + ", " + (point.y - ne.y);
     } else {
       points += " " + (point.x - sw.x) + ", " + (point.y - ne.y);
     }
   }
   return points;
 }

 PolyLineFill.prototype.draw = function() {
   // Size and position the overlay. We use a southwest and northeast
   // position of the overlay to peg it to the correct position and size.
   // We need to retrieve the projection from this overlay to do this.
   var overlayProjection = this.getProjection();

   // Retrieve the southwest and northeast coordinates of this overlay
   // in latlngs and convert them to pixels coordinates.
   // We'll use these coordinates to resize the DIV.
   var sw = overlayProjection.fromLatLngToDivPixel(this.bounds_.getSouthWest());
   var ne = overlayProjection.fromLatLngToDivPixel(this.bounds_.getNorthEast());

   // Resize the image's DIV to fit the indicated dimensions.
   var div = this.div_;
   div.style.left = sw.x + 'px';
   div.style.top = ne.y + 'px';
   div.style.width = (ne.x - sw.x) + 'px';
   div.style.height = (sw.y - ne.y) + 'px';

   this.polysvg_.setAttributeNS(null, "points", this.AdjustPoints());
 }

 PolyLineFill.prototype.onRemove = function() {
   this.div_.parentNode.removeChild(this.div_);
   this.div_ = null;
 }
 window.BW = {};
 window.BW.PolyLineFill = PolyLineFill;
 ///end poly fill code


 google.maps.event.addDomListener(window, 'load', initialize);


 //**************************velho
 function showArrays(event) {
   if (this.overlay)
     this.overlay.setMap(null)
   this.overlay = new BW.PolyLineFill(this.getPath().b, this.map, "red", "#000");
 }
     html,
     body {
       height: 100%;
       margin: 0;
       padding: 0;
     }
     
     #map-canvas,
     #map_canvas {
       height: 100%;
     }
     
     @media print {
       html,
       body {
         height: auto;
       }
       #map_canvas {
         height: 650px;
       }
     }
<script src="https://maps.google.com/maps/api/js?sensor=false&libraries=drawing&.js"></script>
<div id="map-canvas"></div>
1
  • I don't see a shape on the map at the Fiddle demo. Has it stopped working?
    – isherwood
    Apr 17 at 0:16

Your Answer

By clicking “Post Your Answer”, you agree to our terms of service and acknowledge you have read our privacy policy.

Not the answer you're looking for? Browse other questions tagged or ask your own question.